FOREXWALLSTERMINAL
INITIALIZING MARKET INTELLIGENCE

MARKET DATA        ░░░░░░░░░░
ANALYTICAL CORE    ░░░░░░░░░░
VISUAL ENGINE      ░░░░░░░░░░
v1.0 · Proprietary quantitative environment
ForexWalls Terminal

ALL-IN-ONE TERMINAL / FOR METATRADER 4 & 5

Pre-order · 20% off your first 2 monthsOfficial launch 25 November 2026 · limited places

--DAYS
:
--HOURS
:
--MIN
:
--SEC
Reserve your place · −20%

The whole market in one terminal.One subscription. Nothing else to buy.

News, order flow, positioning, forecasts, earnings, probabilities, strength, correlation and risk — everything you would otherwise pay several services for, on the MetaTrader chart you already trade. One login. No add-ons. From €200 a month.

Why traders switch to one licence

Five subscriptions. Five passwords.Or one licence.

To see the whole market, a serious trader usually pays for a stack of separate services — an order-book app and its data feed, a news and calendar service, a stocks and earnings site, positioning and forecast reports. Each one has its own subscription, its own renewal date, its own password and its own login — and almost none of them works inside MetaTrader. ForexWalls Terminal replaces that stack with one licence and puts every answer on the MetaTrader chart you already trade. One payment, one install, one click per answer.

One terminal

Every tool below runs inside the MetaTrader chart you already trade. No second app to open, no second screen to keep alive.

One subscription

One price, one invoice, one login. A higher plan unlocks more windows — never another service to sign up for.

Nothing else to buy

No data add-ons, no per-window fees. The news, the order-book walls, the positioning and the forecasts are inside the licence.

Every monthFive renewals on five different dates — and a service you forgot to cancel still charging your card.
Every morningFive logins, five passwords, five sessions that expire — before you have looked at a single chart.
By handNone of them talks to MetaTrader, so levels, forecasts and positioning get copied onto your chart one line at a time.

One minute before US inflation data. You hold gold.

The same minute, two ways.

The usual way

Five services, one minute

  • Open the calendar site — forecast 0.3%. But how far does gold usually move on this number? No answer there.
  • Switch to the order-book app on the second screen. Different chart, different symbol, different price.
  • Check your stop. Is it outside normal noise, or inside the move a release usually makes? You guess.
  • The number hits. You're still switching back to MetaTrader.

You react to the move. You don't plan for it.

With ForexWalls Terminal

One chart, everything already there

  • A red bar on your chart has been counting down for an hour: CPI, high impact.
  • NEWS IMPACT shows how far CPI has moved gold in its first 15 minutes — measured on every release since 2022, in points for your symbol.
  • The STOP GUIDE says whether your stop survives a normal pullback. The CME walls show where the big resting orders sit (ELITE).
  • The official result appears within minutes — on the same chart you trade from.

You decided four minutes earlier — size, stop, or stay out. Not in the spike.

What you get with one click — and what it replaces

Each of these is usually a separate subscription with its own login. Here each is a button on your chart — under one licence.

Where the big orders sit

Resting orders and order flow from the CME futures that match your symbol, drawn as walls on your MetaTrader chart.

ELITE · replaces an order-book app + data feed
How far news moves you

Calendar, measured impact per release on your symbol, and the official US result within minutes.

PRO · replaces a news site + calendar
Where your stop survives

Trend, entry, stop and targets in one panel — the stop in pips and in money per lot, tested on ~235,000 trend bars.

All plans · replaces a signal library
Stocks and their reports

Next report, the last 12 reactions, financials, company profile and analysts' targets — on the stock's own chart.

PRO / ELITE · replaces a stocks site
Who is positioned against you

COT positioning, bank forecasts with their distance from price, and a deep written analysis checked against the indicator.

PRO / ELITE · replaces several report pages
Where price can be by a date

The probability map: ranges from one week to one year and the odds of reaching your target — measured on the symbol's own history.

PRO · rare outside professional terminals

And the rest of the terminal

More than twenty tools in all, grouped by the question they answer. Your plan decides how many of them you open.

See the marketRegime · Kalman · GARCH · exhaustion · Fibonacci & targets · Wyckoff phases · channel · patterns · stop guide · cone
Know what is comingCalendar · news impact · US economy · rates & dollar · world events · macro strip · alerts
See who is positionedCOT · bank forecasts · CME order-book walls · deep analysis
Range and oddsVolatility 3D · probability map · volume profile · seasonality
The market around youCurrency strength · correlation · position risk — new
US stocksEarnings · analysts · financials · company profile

You still need MetaTrader and an account with your own broker — everything else is in the licence.

1licence · one price
1login · one install
0extra subscriptions
14days free to try

"I built it because I was tired of paying for five subscriptions and still guessing. Every number in it is tested on its own history — including the ones that failed — and the tests are on this page."The founder · a trader and MetaTrader developer

It will not trade for you and it does not promise profit. It gives you the full picture before you click. Works on MetaTrader 4 and 5 with your own broker.

Pre-order · official launch 25 November 2026

Reserve your place.Get in first — 20% off.

  • Early access — you get ForexWalls Terminal before the official launch on 25 November.
  • 20% off your first two months on the plan you choose, then the normal monthly price. The offer is open only until the launch.
  • Limited to 100 places at the pre-order price — checking…. A place counts only once its deposit is paid; when they are gone, the form closes.
  • A 10% deposit secures your place — BASIC €32 · PRO €48 · ELITE €80 (10% of your first two months at the pre-order price). It is deducted in full from your first two payments, and refunded on request at any time until your access opens.
  • At the launch we e-mail you a personal link: your deposit and the 20% are applied automatically (PRO: €216 + €216 + the €48 deposit = 2 × €240).
  • One reservation per e-mail.

BASIC

€200 €160A MONTH · FIRST 2 MONTHS

PRO

€300 €240A MONTH · FIRST 2 MONTHS

ELITE

€500 €400A MONTH · FIRST 2 MONTHS
--DAYS
:
--HOURS
:
--MIN
:
--SEC

Reserve my place

Next step: the secure deposit checkout (card payment through Stripe). The deposit is deducted from your first two payments and refunded on request until your access opens — see the terms. Pre-order price for your first two months, then €200 / €300 / €500 a month. Prices before VAT — the total for your country is shown at checkout. A tool for analysis, not a promise of profit.

What you get — and what it costs

One terminal instead offive subscriptions.

An economic calendar with the real results, a COT service, an earnings tracker, a volatility tool and a news terminal — inside the MetaTrader 4 or 5 chart you already trade, and checked against the market's own history.

BASIC

€200per month

14-day free trial · card required

Read the market in one look

  • The panel: trend, regime and volatility in plain words
  • Your stop in pips and in money per lot — H1, H4, D1
  • VOLATILITY 3D: how far price can go in the next bars
  • Fibonacci targets, exhaustion count 9 / 13, Wyckoff D1
  • Red alert bar before every high-impact release

1 MT4/MT5 account

Get BASIC

PRO most chosen

€300per month

14-day free trial · card required

Know what can move it — and how far

  • Everything in BASIC, plus:
  • News analysis: CPI, PPI, payrolls, GDP, the Fed — the official result within minutes and what it did to your symbol
  • NEWS IMPACT: the usual move of every release, in pips
  • Company earnings: Apple, Microsoft, Nvidia and every US stock — next report, the last 12 reactions, 8 quarters of results
  • COT positioning, Treasury yields and the dollar

2 MT4/MT5 accounts · priority support

Get PRO

ELITE

€500per month

14-day free trial · card required

See where the big orders sit

  • Everything in PRO, plus:
  • CME order-book walls and the flow box on your chart
  • Deep analysis for 1–5 days, checked against the indicator
  • What the big banks forecast, and how far it is from price
  • World events with the market reaction actually measured

3 MT4/MT5 accounts · priority support

Get ELITE

Pre-order: 20% off your first two months, open until the official launch on 25 November 2026. Prices per month, before VAT — the total for your country is shown at checkout · 14-day free trial — card required, nothing is charged during the trial; unless you cancel, the first payment is taken on day 15 and the plan then renews every month until you cancel · we e-mail you 3 days before every charge · cancel online any time · 14 days to change your mind after your first payment · a tool for analysis, not a promise of profit.

News analysis · PRO

CPI, PPI, payrolls, the Fed —read for you, on your chart.

Every major US release with the latest value, the revision, how unusual it was against the last 24 releases, and how your symbol moved one hour and one day after it. CPI, payrolls, unemployment, PPI and crude stocks come straight from the official US releases within minutes — even when the MT5 calendar is late.

Before the release: how far it usually moves

NEWS IMPACT lists every release in the next 36 hours with the usual move of your symbol in the first 15 minutes and the first hour, the strong move, and how many times a normal hour that is. A US CPI release moves EUR/USD about four times a normal quarter-hour. Measured on broker M15 prices 2022–2026.

The calendar, rates and the dollar

The next releases with forecast, previous and actual and a live countdown; the Treasury curve and the dollar in plain words, with one conclusion for your symbol — for example “Pressure DOWN (strong dollar)”.

The week ahead, day by day

THE WEEK puts the next five trading days on one screen: the key release of each day, the company reports, what the big banks expect for your symbol, and the releases that have moved it the most — with the typical first 15-minute move for each one. You see the busy days before Monday opens.

Fed watch: what the market expects from the Fed

The odds of a hold, cut or hike at the next meetings, worked out from the futures on the Fed rate, how they moved over the last 7 days and over 30 or 90 days, with the big shifts marked on the chart. It shows what the market already prices in — the context you want before every Fed day.

Company earnings · PRO

Apple, Microsoft, Nvidia —every report, on the stock's chart.

Open any US stock and the EARNINGS window shows the next report date, how the stock reacted to its last 12 reports on your broker's prices — gap, day move, move in ATR — how often a report went through a normal stop in one day, and eight quarters of revenue and earnings per share with the change against a year earlier. New tabs: PROFILE (who the company is and its key numbers), FINANCIALS (years and quarters) and, on ELITE, ANALYSTS. From the companies' official reports.

Why it matters before you hold a stock into a report

On Microsoft, a normal 2.8 ATR stop was 5.9% of the price on 15.10.2026 — and 6 of the last 12 reports moved the stock further than that in a single day, the largest 15.4%. On Apple it was 2 of 12. The window shows this for every US stock your broker offers, from the companies' official reports, so you size the position before the report, not after.

  • Next reportdate, before the open or after the close, days left
  • Last 12 reactionsgap · day move · move in ATR · stop hit or not
  • 8 quartersrevenue and EPS with the change against a year earlier
  • Profilewhat the company does, its business lines, market cap, P/E, dividend yield, 52-week range, latest filings
  • Financialsup to six fiscal years with every quarter: revenue, EPS, growth, net margin
  • AnalystsELITE · buy / hold / sell split, average and range of 12-month targets, the latest upgrades and downgrades with date and firm

Why traders install it

Three questions decide every trade.Answer them before you click.

Where does my stop survive? How far can the next release move this symbol? Who is positioned against me? ForexWalls Terminal answers each one on your MetaTrader chart — with the number, the sample it was measured on, and the test that checks it.

Stop guide

80%

Stops that survive normal noise

Of all pullbacks inside trends, 80% stayed under 2.8 ATR. The panel turns that into your stop in pips and money per lot for H1, H4 and D1.

~235,000 trend bars · 19 instruments
News impact

×4

Know the hit before it lands

A US CPI release moves EUR/USD about 0.31% in 15 minutes — four times a normal quarter-hour. You see the typical and the strong move for your symbol before every release, and the official result within minutes.

12 symbols · M15 · 2022 – 2026
Volatility 3D

80.5%

A range that means what it says

The 80% zone held 79.7 – 81.3% of closes out of sample. Size your position and set targets inside a range that has been checked, not guessed.

13 instruments · H1 / H4 / D1
One chart

1

Everything in one place

Calendar, COT positioning, US earnings, bank forecasts and world events next to your candles — instead of five tabs and separate subscriptions.

Forex · gold · indices · oil · US stocks

Every number is measured. Each tool is tested on years of real prices against a random control — the 80% range held 79.7–81.3% of closes, a strong correlation stayed strong 95% of the time, breakouts with a strong bar went on 64% of the time. Each card tells you what the tool is best for, so you know exactly which numbers to lean on.

14-day free trial, then monthly until you cancel · cancel online any time · every number measured on real price history.

A terminal, not another indicator

A market-intelligence terminalinside your MetaTrader.

Professional desks pay thousands a month for terminals that put macro data, order flow, positioning and statistics on one screen. ForexWalls Terminal brings that way of working to the chart you already trade — MetaTrader 4 or 5 — at a fraction of the cost.

One screen

1

Everything next to your candles

Economic calendar and news impact, COT positioning, US earnings, bank forecasts and world events — inside the chart, instead of five browser tabs and separate subscriptions.

Forex · gold · oil · indices · US stocks
Institutional data

CME

Where the big orders sit

Resting order-book size and order flow from the CME futures that match your symbol, drawn as walls on your chart (ELITE). Walls can be pulled before price reaches them — the panel says so.

Major currencies · gold · oil
Statistics, not emotion

%

Measured probabilities you can plan with

How far a release usually moves your symbol, how often a stop survives normal noise, how wide the honest range is — each number with the sample it was measured on.

~235,000 trend bars · 19 instruments

What it is not. It is not a full professional terminal: no bank chat rooms, no coverage of every asset on the planet, no live newswire. It focuses on what a forex, gold, index and US-stock trader looks at every day — and it never trades for you.

  1. Speaker oneI had the level right. I just couldn't see what the market was doing around it.
  2. Speaker twoEvery time I size up, the regime changes on me.
  3. Speaker threeI don't want another signal. I want to know what state we're in.
  4. Speaker oneBy the time it's obvious, it's already priced.

The market doesn't care.

About your last trade.

Every trader has a trade

they wish they could see again.

The question is…

What did you miss?

  • Regime?
  • Volatility?
  • Liquidity?
  • Structure?
  • Context?

ForexWalls Terminal

The answer to
what you missed.

Regime · Volatility · Liquidity · Structure · Context

Overview

01 — What you get

Everything onone MT4/MT5 chart.

ForexWalls Terminal is an indicator for MetaTrader 4 and MetaTrader 5. It reads the market in independent layers — regime, trend, volatility, structure, cycles, news and positioning — and shows them together on your chart. This is a real screenshot (gold, daily, 25 October 2026). Hover or tap a number to see what it is.

    ForexWalls Terminal is an analytical tool. It does not trade for you, does not provide investment advice and does not promise outcomes. Decisions and risk remain yours. Read the full user guide →

    Inside — the engine · 10 modules

    TheEngine

    Ten analytical layers, each tested on its own history.
    New: VOLATILITY 3D and the CONE.

    Hover a module  ·  click to enter

    Panel

    02 — The panel · market state

    Trend or range?Young or old?

    The top of the panel answers the first question of every trade: which way is the market going — for the next hours, days and weeks — and how old is the move.

    Trend by horizon
    Intraday (hours), swing (2–10 days) and position (weeks), each RISING, FALLING or MIXED, with one line that says whether they agree: “the trend is ▼ on every horizon”. Below: the next important release, the Fed odds and the volatility level.
    Trend · Kalman
    The direction of the noise-filtered trend and how many bars it has lasted, the typical life of a trend on this symbol, its strength (NEW → STRONG → FADING) and the risk — with one plain instruction, e.g. “No new entries with the trend · protect profit”.
    Exhaustion
    The exhaustion count — setup 9 and countdown 13 — that warns when a move is getting old.
    Order flow
    Buying vs selling pressure over the last bars, with the imbalance and how confident the reading is.
    Entry

    03 — Entry, stop & targets

    A plan,not just a signal.

    The lower half of the panel turns the reading into a trade plan you can check: is there an entry, where is the stop, what does it cost, and how realistic is the target.

    Consensus & entry
    A weighted vote of the models with its agreement (“4/6 agree”), then SELL READY / BUY NOW / WAIT — and when it says WAIT, exactly what is missing.
    Stop guide
    2.8 ATR for H1, H4 and D1, in price and in money for 1 lot. Tested: survives about 8 of 10 normal pullbacks.
    Correction & regime filter
    Below the entry: the higher-timeframe correction check, the trend-strength filter (trending or ranging) and the expected range for the next 25 bars.
    Fibonacci extension targets
    T1 and T2 beyond the swing with their distance in ATR: “T1 Ext 127.2%: 3951.43 (2.3 ATR)”.
    Fibonacci

    04 — Fibonacci · retracement & extension

    Where it pauses.Where it could run.

    The engine picks the one swing that matters and keeps it stable — no redrawing on every candle. Retracement levels show where a pullback usually pauses; extension levels show where a continuation could run.

    • 23.6
    • 38.2
    • 50.0
    • 61.8
    • 78.6
    • EXT 127.2 · 161.8 · 200
    Two buttons
    FIB shows the retracement, FIB EXT the extension targets. Keep one, the other, or both.
    Summary line
    “FIB DOWN conf 56% R/ATR 7.4 MTF 0%” — direction, confidence, size of the leg and how many levels line up with the timeframes above and below.
    Best use
    The strongest levels are the ones that line up with the timeframes above and below — the MTF number tells you how many do.
    Cycles

    05 — Market cycles · Wyckoff

    Accumulation or pause?Every timeframe.

    ForexWalls Terminal finds the trading range, decides whether it is accumulation or distribution, and labels the phase A–E with a confidence. It shows the phase on W1, D1, H4, H1 and M15 side by side, and it knows when a cycle is already spent.

    Manipulation zone
    The Spring (below support) or Upthrust (above resistance) where stops were run — highlighted in magenta and explained in words: “Shakeout below support. A quick recovery is the entry signal.”
    Phases on every timeframe
    “W1 ACC-A · ▸D1 ACC-B · H4 ACC-C · H1 ACC-D · M15 DIST-C” — see at once whether the bigger picture agrees with yours.
    Honest about new ranges
    A young range gets a “?” and a capped confidence: “accumulation or pause? Breakout decides.”
    Sequential

    06 — Exhaustion count 9 / 13

    Is the movegetting tired?

    Exhaustion counts on the candles: a setup that completes at 9 and a countdown that completes at 13, with setup range lines as support and resistance, and risk and target lines after a 13. Based on the exhaustion-count method published by Thomas R. DeMark in his books — independently implemented and tested on real data.

    On the chart
    Green counts below the lows (buy setup), red above the highs (sell setup), gold for the countdown. 9✓ and 13✓ are perfected.
    In the panel
    The current state, e.g. “CD-S 9/13” — a sell countdown at 9 of 13 — and the DAM oscillator in the consensus.
    Best use
    A 9 or a 13 says the move is getting tired — time to protect profit, and to wait for the panel before turning around.
    Volatility

    07 — Volatility 3D · new in v33.26

    How far can it move?Measured, not guessed.

    One button — VOLATILITY 3D — opens a window the size of your chart. It shows the volatility regime, four forecasting models ranked on your symbol, the expected range for the next bars, the high-impact releases inside that range, and three 3D surfaces you can turn with the mouse. It answers how far price usually travels — the number you need for stops, targets and position size.

    1 · The whole window

    The numbers live on the left, the 3D view on the right. Everything is recomputed from your broker's own data when you open the window and on every new hour — nothing is downloaded, nothing is guessed. Close it with ✕ or ESC and the chart comes back exactly as it was.

    RANGE surface (shown here). Front to back: bars ahead (1 to 35 on H4 — about six days). Left to right: the size of the move in ATR, with the real price next to each step (for example “+2.1 ATR 4251.92”). Height and colour: how often the past 1,500 bars of this symbol ended there. The ridge spreads as the horizon grows — the width of the mountain at bar 35 is the real risk of a five-day trade. The surface is mirrored, so it carries no direction.

    Mouse. Hold the left button and drag to rotate · wheel to zoom · the colour bar on the right and the numbers on the walls are the levels.

    2 · Reading the numbers, top to bottom

    Volatility regime
    Today's 20-day realised volatility against the last three years: compression (below the 20th percentile), normal, expansion (above 70) or stress (above 95). The marker on the bar is where we are now — gold D1 here: normal, percentile 58.
    Last 5 / 22 days
    Turns orange above 1.3×: the last week has been much rougher than the month — a burst is under way.
    Volatility forecast
    Four models forecast volatility for the next 5 and 20 days: a 20-day average (RW20), EWMA, GARCH(1,1) and HAR-RV. QLIKE is each model's error against the plain average over the last 250 forecasts, every one made only from data that existed at the time. Green and negative = more accurate. The orange value is the model that has been most accurate on this symbol — that is the one to read.
    Expected range
    Where price can be after the cone horizon. 50%: the usual move. 80%: eight times out of ten price stays inside. A stop placed inside the 80% band will be hit easily.
    Events in horizon
    The high-impact releases (CPI, NFP, rate decisions) that fall inside the range — around them the range is wider in practice.
    Market-implied
    ATM implied volatility, 25-delta risk reversal and butterfly, and the term structure from the options market — arriving with the options feed.

    3 · RV TERM — how calm or rough, at every scale

    Realised volatility measured over windows from 1 to 60 days (left to right), for each of the last 60 days (front to back), annualised. When the short windows (1–5 days) stand high while the long ones stay low, a burst has just started. When the short end sinks below the long end, the market is going quiet — the classic set-up before a range breaks. The ridges in this picture are the volatility spikes of the last two months.

    4 · IV SURFACE — what the options market is pricing

    Implied volatility by delta (10-put to 10-call) and expiry (one week to six months), built from CME options on gold and euro futures. It shows which side the market pays more to insure, whether a near-term event is priced, and how the next weeks compare with the next months. Market-implied (what options price) and model forecast (what the realised-volatility models expect) are shown apart, because they can disagree — and the gap is information.

    The options feed is being connected. Until fresh data arrives the surface stays grey and says N/A — it never shows an old surface as if it were live.

    How to use it
    1 · The regime tells you whether the market is calm or rough. 2 · The 80% range tells you how much room a trade needs. 3 · The events tell you when to be careful. Direction and entry stay with your own method.
    Tested
    The range method (the symbol's own 1,500 bars, scaled by today's ATR): 50.1–50.5% of closes inside the 50% zone and 79.7–81.3% inside the 80% zone, out of sample, 13 instruments, H1 / H4 / D1.
    Best use
    Volatility is the part of the market that can be measured well — use it for stop distance, size and timing, and take the direction from the panel.
    Cone

    08 — The cone

    A picture of the swing.A number for the risk.

    The CONE button draws the classic ForexWalls Terminal path: a push, a pullback and a continuation, inside a filled channel that narrows where the pullback is expected. It stops exactly at the left edge of the panel, so it never covers your numbers, and it switches on and off instantly.

    1 · What each part means

    Magenta line
    The path. The first third follows the Kalman filter's current velocity, the middle third draws the pullback against the trend, the last third heads to the target.
    Violet channel
    Opens from the current price, narrows into a waist where the model places the pullback, and widens toward the end. Its width follows ATR, GARCH and the regime's confidence.
    Target
    From the higher timeframe's slope, kept within the distance price normally covers in that many bars (0.9 × ATR × √bars) — so the path stays on the screen and within reason.
    Edge of the panel
    The path and the channel are cut where the right-hand panel begins, and re-cut when you scroll or zoom. No labels run into the dashboard.

    2 · On and off

    One click on CONE ON removes the path at once; one more click draws it again on the spot — no waiting for the next bar. The choice is remembered for the next time you open MetaTrader.

    Use it for
    Seeing the shape a typical swing takes from here — where a pullback would usually sit and how far a continuation usually runs. Pair it with the 80% range in VOLATILITY 3D for the stop and the size.
    Tested
    89,203 historical paths on 13 instruments: the direction was right 50.1% of the time against a 50.3% base, and the narrow channel held the close 1–13% of the time. That is why it is drawn as an illustration — the label on the chart says so.
    Best use
    A quick picture of a typical swing on the chart; for exact numbers open VOLATILITY 3D.
    Profile

    08 · B — Volume profile · new · PRO

    Where the market traded.Where value sits.

    The PROFILE button draws how much was traded at every price: one profile for each of the last sessions inside the chart, and one for everything you can see, docked at the left edge. It marks the POC, the 70% value area and the naked POCs price has not traded again — built from one-minute bars, so its shape matches the real tick-by-tick profile.

    1 · What each part means

    POC
    The price where most trading happened — where the market agreed most on value. Orange line with its price.
    Value area
    VAH to VAL, coloured: 70% of the volume. Price inside means balance — the market accepts these prices and often rotates around the POC.
    Above VAH / below VAL
    Imbalance. Closes outside the area mean value is moving; a quick return inside means the new prices were rejected. The header says where price stands.
    Naked POC
    A past session's POC that price has not traded since — orange dashed line to the edge of the panel. A reference level, not a target.

    2 · The explanation is on the chart

    A click on ? next to the profile header opens a short guide: what POC, value area and naked POCs mean, what to watch when price leaves value — and what the test found. Nothing to look up elsewhere.

    3 · In the deep analysis

    The ANALYSIS window adds the profile to its watch levels: yesterday's and the 5-day POC / VAH / VAL, where price stands against each, the nearest naked POC above and below with its distance in daily ATR — and one plain sentence: balance, or an imbalance up or down and what would confirm it.

    Use it for
    Context: is the market in balance or exploring new prices, where yesterday's and this week's value sit, and which levels were left untested. Read it together with the trend and the stop guide.
    Tested
    Precision: built from one-minute bars the profile matched the tick-by-tick profile with a correlation of 0.978 and put the POC within 2% of the day's range in 10 of 10 sessions (from hourly bars: 0.83, POC 11% off). Edge: on 8 instruments over ~44 days, bounces at POC / VAH / VAL came 50% / 50% / 53% of the time against 49% at random prices; the "80% rule" 41% against 41%.
    Best use
    Where price slows down and where it passes quickly — combine the levels with the trend and the Wyckoff phase. Forex has no central volume, so tick volume is used; real volume where the broker supplies it. On MT4 older sessions may be built from M5 bars (the header shows the source).
    Odds

    08 · C — Probability map · new · PRO

    Where can the price bein a week, a month, a year?

    The PROBABILITY button opens a full window for the symbol on your chart: the price range for 1 week to 1 year, how often the price really stayed inside such a range, a probability cone one year ahead — and the chance that the price reaches a price you type in before a date. Measured on that symbol's own history, computed in your terminal.

    1 · The window at a glance

    Ranges by horizon
    For 1W, 1M, 2M, 3M, 6M, 9M and 1Y: the date, the ±1σ range, how often the price ended inside it, the 90% range (5–95%), the median and the volatility per year. A click on a row moves the charts to that horizon.
    Volatility now vs 5 years
    Today's volatility against its 5-year level, in one line: calm (ranges tend to widen), normal, or nervous (ranges tend to shrink).
    Distribution
    How the moves of this symbol were spread over the last 5 years at the chosen horizon, with today's price, the ±1σ range and your target marked. On ELITE the banks' published targets are drawn as bars.

    2 · Your target price, in odds

    Type a price — or press +1σ, −1σ or bank median. For every horizon the window shows two numbers: the chance the price closes beyond it on the date, and the chance it touches it before the date. Touching is always more likely than closing beyond — the gap between the two is the trade you have to manage. The target is remembered for each symbol.

    3 · The cone, one year ahead

    The last three months of daily closes and, to the right, where the price stayed 90% and 50% of the time over the same distances in the past five years — with the median, your target line and, on ELITE, the banks' targets placed at their horizon. ⧉ puts the window on a second monitor.

    Use it for
    Sizing and planning: how far the market usually goes in the time you plan to hold, whether a target is realistic before your date, and whether a bank's forecast is a normal move or an outlier.
    Tested
    Walk-forward on daily prices 1971–2026, 7 major currency pairs, each number from past data only. The ±1σ chance missed the real frequency by 1.3 points on average (max 3.3); the 5–95% ranges by 1.6; "closes beyond the target" by 0.8; "touches the target" by 0.9.
    Best use
    Check whether your target is realistic before your date, and plan holding time and size. Touches are counted on daily closes, so intraday spikes can touch a level more often. Needs at least 300 daily bars; with less than 200 past cases it falls back to the normal curve.

    New · one button, four tools

    Strength. Correlation.Risk. Seasonality.

    Click MARKET TOOLS and four full-size windows open as tabs: which currencies are strong right now, which of your markets move together, what your open positions can lose, and what the calendar says about this month and this weekday. Measured on your broker’s own price history, calculated in your terminal — no extra service, no extra login.

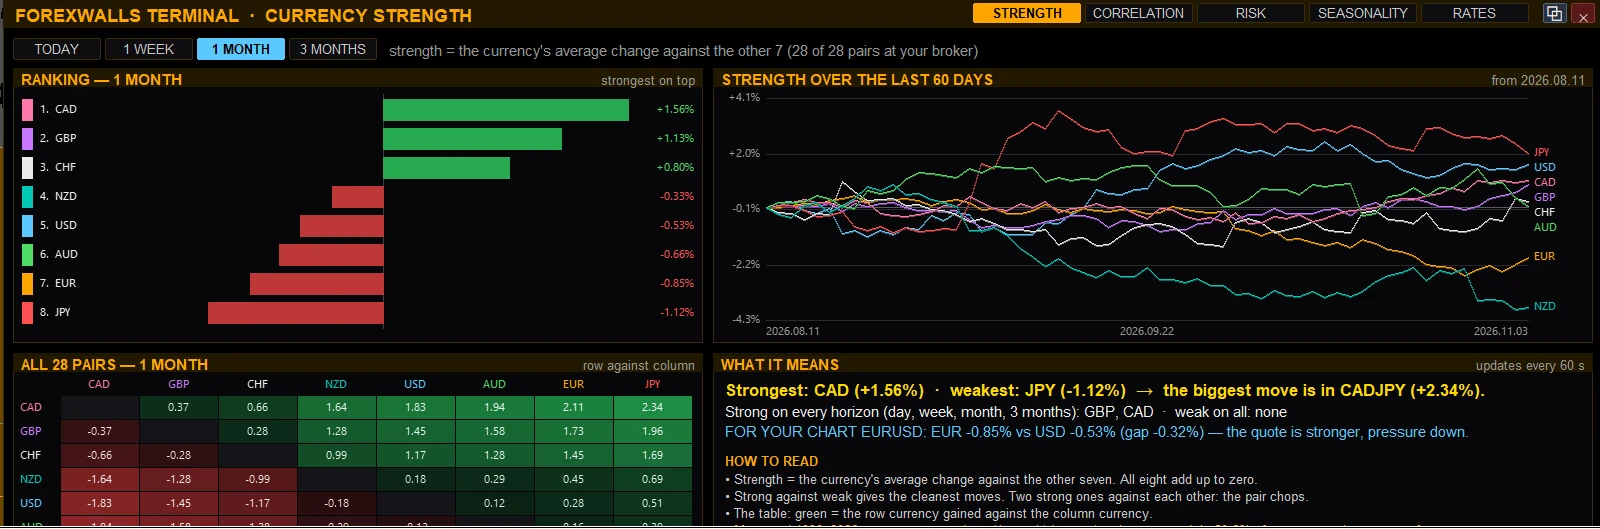
    MARKET TOOLS — STRENGTH: ranking of the eight major currencies for one month, 60-day lines, the 28-pair table and the plain-language summary
    STRENGTH · 1 MONTH · CAD strongest, JPY weakest, all 28 pairs at the broker · captured on 3 November 2026

    Currency strengthAll plans

    Which currencies are strong, which are weak right now — and which pair has the biggest gap?

    How it works

    For each of the eight majors — USD, EUR, GBP, JPY, CHF, CAD, AUD, NZD — the window averages its move against the other seven, using all 28 crosses at your broker. The eight strengths add up to zero: what one currency gains, the others lose. You get the ranking, the last 60 days as lines, the 28-pair table (row against column) and one plain sentence: strongest, weakest, and where the biggest move is.

    What to watch
    • Strong against weak gives the cleanest moves. Two strong currencies against each other: the pair chops.
    • A currency that is strong on every horizon — day, week, month, 3 months — is the one to look at first.
    • On a gold or index chart, compare the dollar’s strength with the direction of your symbol.
    Best timeframes
    Intraday
    TODAY and 1 WEEK
    Swing
    1 WEEK and 1 MONTH
    Position
    3 MONTHS
    It reads daily prices, so it does not change with the timeframe of your chart.
    How it was checked

    Measured 1999–2026: the strongest currency against the weakest over a month kept going the next week in 50.6% of cases. It shows where the money is moving right now.

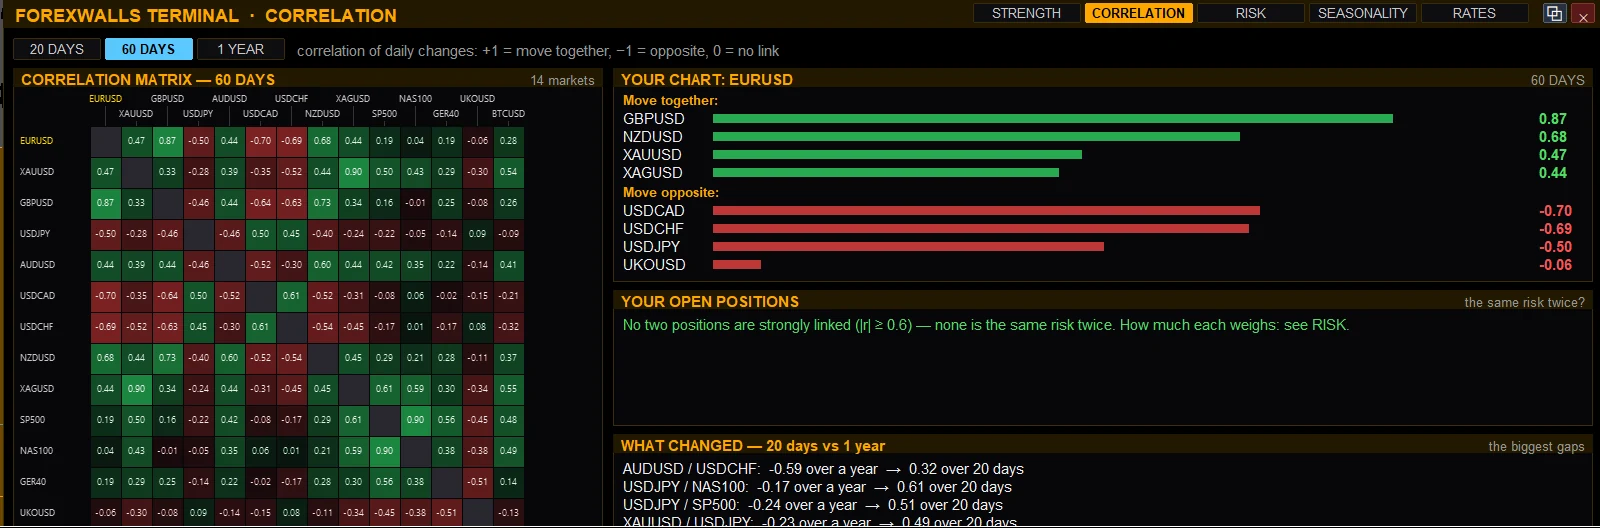
    MARKET TOOLS — CORRELATION: matrix of the markets, the markets that move with and against your chart, your open positions and what changed
    CORRELATION · 60 DAYS · 14 markets, EUR/USD’s partners, your open positions, and what changed · captured on 3 November 2026

    CorrelationPro · Elite

    Which of my markets move together, which move opposite — and are my open positions the same risk twice?

    How it works

    Correlation of daily changes, from +1 (move together) through 0 (no link) to −1 (opposite), for up to 14 markets: your chart’s symbol, the major pairs, gold, indices and what else your broker offers. Three windows — 20 days, 60 days, 1 year. The window shows the matrix, the markets that move most with and against your symbol, your open positions with a warning when two of them are the same bet, and WHAT CHANGED: the pairs whose 20-day link differs most from their 1-year link.

    What to watch
    • Two positions with r above 0.7 in the same direction are double risk. Opposite positions with a strong link cancel out.
    • When a stable link jumps by more than 0.30, something has changed in the market — look at why before you trade it.
    • Use the 1-year view to judge a basket of trades, the 20-day view for what is happening now.
    Best timeframes
    Intraday
    20 DAYS
    Swing
    60 DAYS
    Position
    1 YEAR
    It reads daily prices, so it does not change with the timeframe of your chart.
    How it was checked

    Measured 1999–2026 on currency pairs: a strong link (|r| ≥ 0.7) stays at least 0.5 over the next 60 days in 95% of cases — a link you see today is a good bet to still be there.

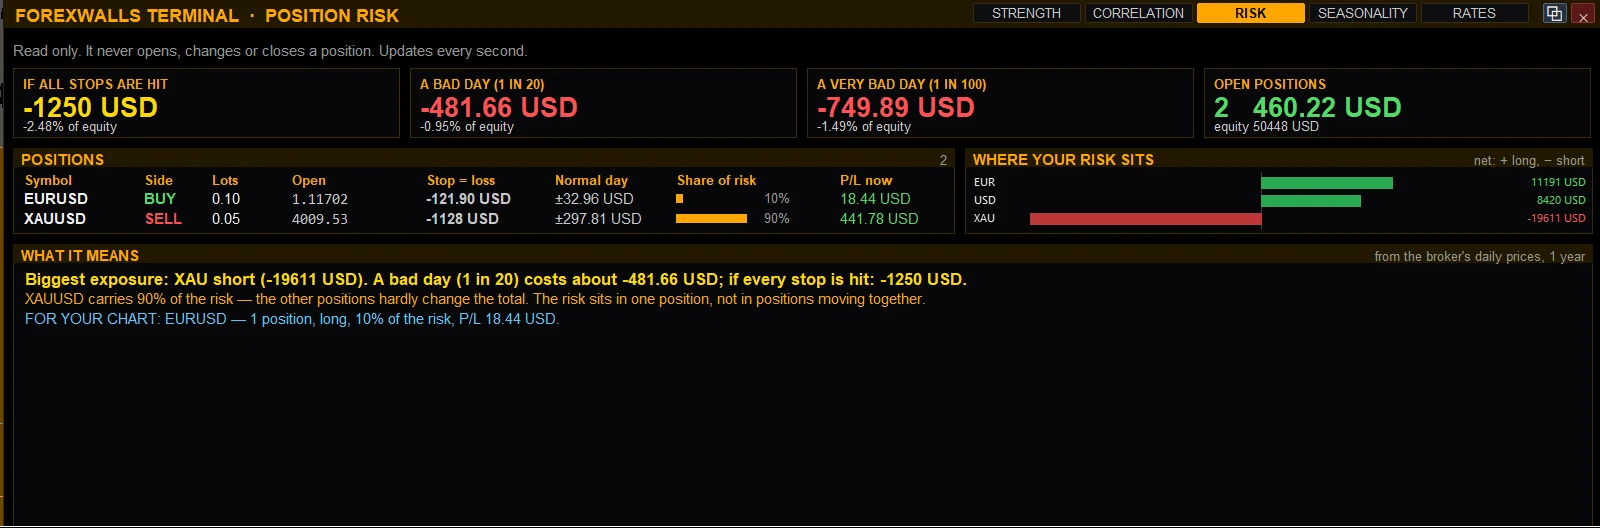
    MARKET TOOLS — RISK: loss if every stop is hit, a bad day, a very bad day, each open position and where the risk sits
    RISK · two demo positions: gold carries 90% of the risk · read only, it never touches a trade · captured on 3 November 2026

    Position riskAll plans

    What can my open positions lose — if every stop is hit, on a bad day, on a very bad day — and where does the risk really sit?

    How it works

    Read only: it never opens, changes or closes a position. From your open positions, each symbol’s recent volatility and the links between the symbols, it shows four numbers: the loss if every stop is hit, a bad day (a move that happens about once in 20 trading days), a very bad day (about once in 100) and your open positions with the equity. Below: each position — stop = loss, a normal day, share of the total risk, profit or loss now — and where the risk sits by currency or market, net long or short. It updates every 10 seconds.

    What to watch
    • Share of risk: if one position carries more than half of it, you have one trade, not five.
    • Compare the total with the sum of the parts: positions that move together add up, opposite positions reduce the total.
    • If the bad-day number is more than you would accept, change the size before the day, not during it.
    Best timeframes
    Intraday
    the normal day and the bad day
    Swing
    the bad day and the very bad day
    Position
    the very bad day, and where the risk sits
    It works on your account’s positions, not on one chart — the timeframe of the chart does not matter.
    How it was checked

    A bad day is 1.67 and a very bad day 2.60 standard deviations of your positions’ daily move, estimated from the last year of daily prices. It is a statistical estimate — a real day can be worse.

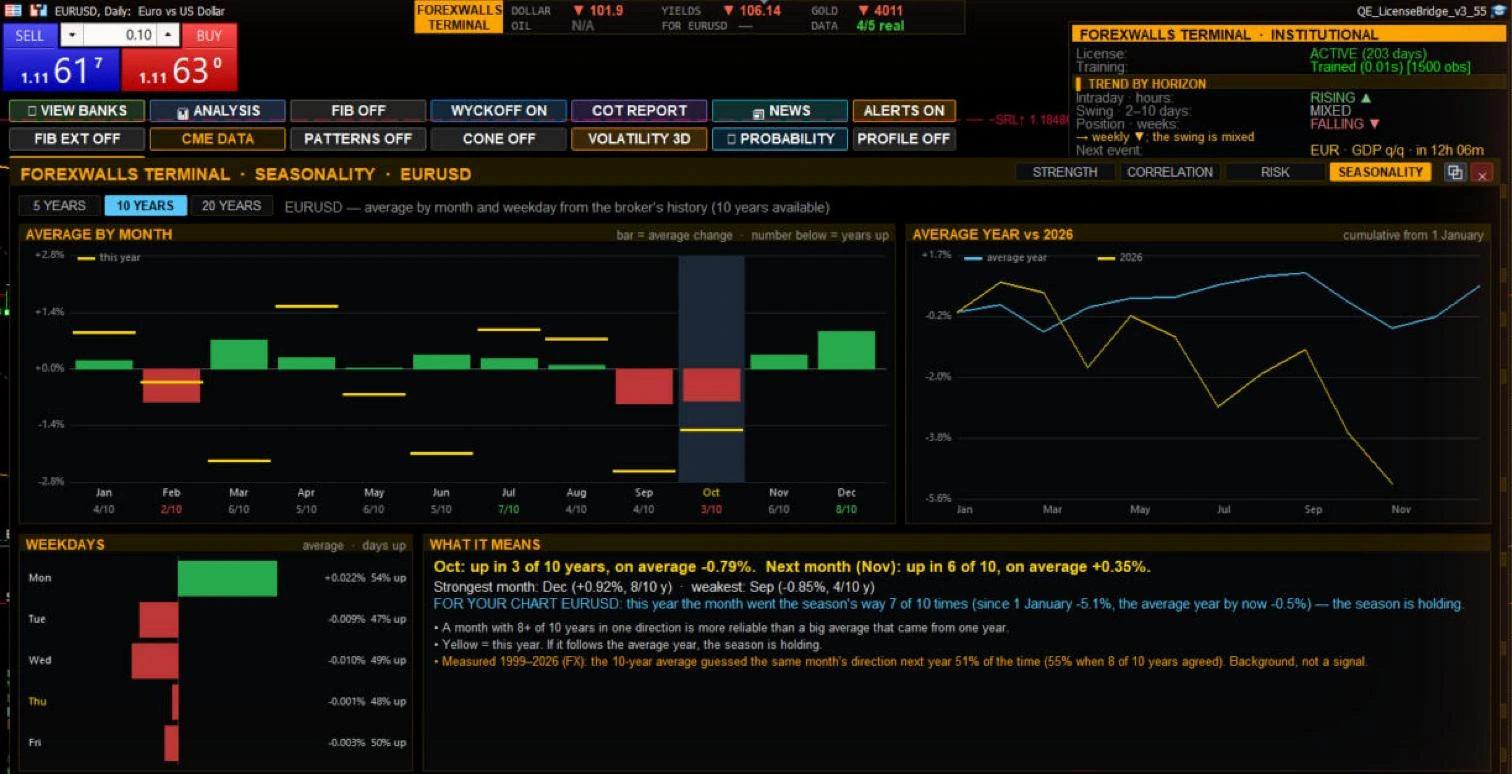
    MARKET TOOLS — SEASONALITY for EUR/USD: average change by month with years up, the average year against this year, weekday averages and what it means
    SEASONALITY · EUR/USD, 10 years · average by month, the average year against 2026, weekdays · captured on 29 October 2026

    SeasonalityPro · Elite

    What has this market usually done in this month and on this weekday — and is this year following the pattern?

    How it works

    From your broker’s monthly history of the chart’s symbol — 5, 10 or 20 years, as many as are available — it shows the average change of each month with how many of those years closed up (for example 6/8), the weekday averages with the share of up days, and a line for the average year against this year so far. The current month is highlighted, and one sentence says how often it closed up and what the next month usually does.

    What to watch
    • A month with 8 or more years out of 10 in one direction is more reliable than a big average that came from one year.
    • Yellow marks this year: if it follows the average year, the season is holding; if not, the season is not what drives the market now.
    • Use it as background next to the trend, never as an entry.
    Best timeframes
    Intraday
    the weekday averages only
    Swing
    this month and the next
    Position
    the average year, 10–20 years
    Months, not hours: use it on D1–W1 charts.
    How it was checked

    Measured 1999–2026 on currency pairs: the 10-year average guessed the same month’s direction next year 51% of the time — 55% when 8 of 10 years agreed. Best as background next to the trend.

    StrengthWhat is strong, what is weak?
    CorrelationIs this a second bet on the same thing?
    RiskHow much can I lose, and where?
    SeasonalityIs the calendar with me?

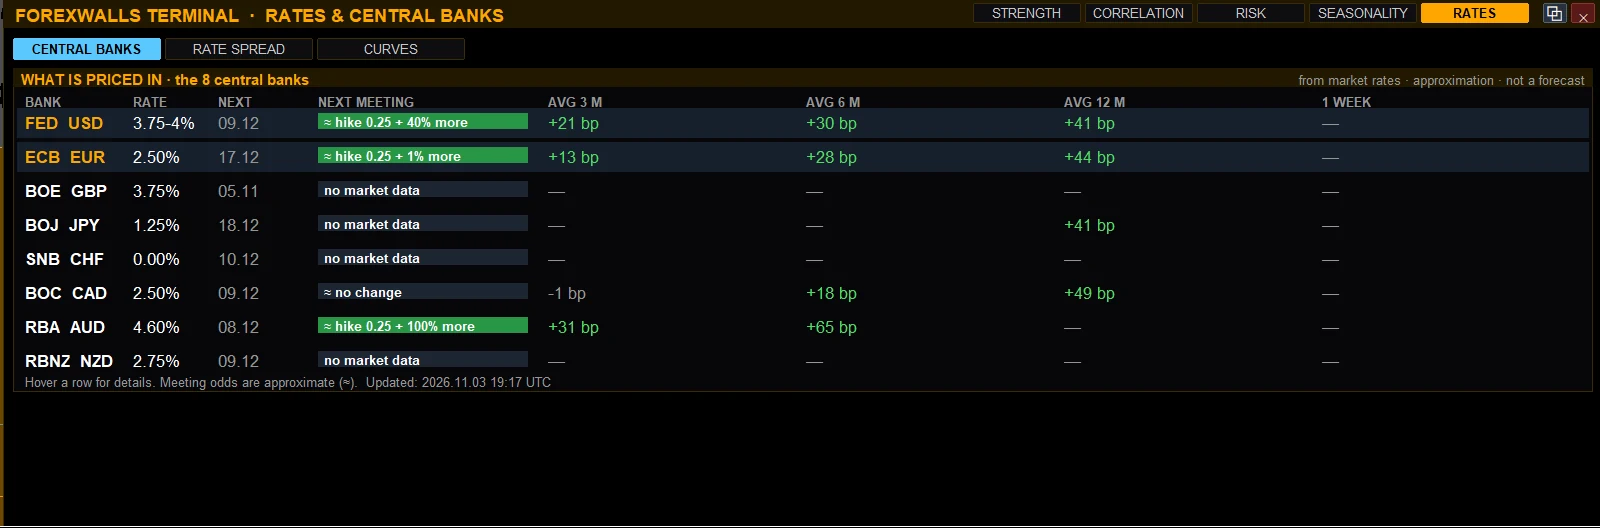
    RATES — the central banks behind your pair Pro · Elite

    The fifth tab: all 8 central banks with the next meeting and what the market prices in, the 2-year rate spread of your pair drawn with the price, and the two yield curves — today against a month ago. Rates are the slow force behind every currency pair; here you see them next to your chart.

    MARKET TOOLS — RATES: the 8 central banks, next meeting and what is priced in
    RATES · CENTRAL BANKS · what the market prices for the next meeting and for 3, 6 and 12 months · captured on 3 November 2026

    Real captures from MetaTrader 5, English interface. RISK is read-only: it never opens, changes or closes a trade. Every value is measured on your broker’s price history.

    News

    09 — News, macro & world events

    What could movethe market today.

    On every plan the FOREXWALLS MACRO strip shows the dollar, yields, oil and gold, and a red bar warns before high-impact news. The NEWS button (PRO) opens five tabs — including NEWS IMPACT, how far your symbol usually moves on each release; WORLD EVENTS is in ELITE.

    Calendar. The next releases for your symbol's currencies with impact, forecast, previous and actual, a live countdown, the next high-impact release and today's results. Key US results — CPI, payrolls, unemployment, PPI, crude stocks — come straight from the official US releases within minutes of the release, even when the MT5 calendar is late.

    US economy. Growth, inflation, labour and Fed policy as four tiles, then every major indicator: latest value, revisions, how unusual it was against the last 24 releases, and how your symbol reacted one hour and one day later. Official US data.

    Rates & dollar. The Treasury curve with 1, 5 and 20-day changes, the dollar in plain words, and one conclusion for your symbol — e.g. “Pressure DOWN (strong dollar)”.

    News impact. For every upcoming release: how far your symbol has usually moved in the first 15 minutes and the first hour — in pips or points — the strong case, and how many times a normal hour that is. A smaller stop than the strong move is easily taken. Direction is shown only as a measured scenario: after a big surprise GBP/USD moved the textbook way in 59% of 336 cases; small surprises showed no direction at all.

    ReleaseEUR/USDGoldNasdaq-100
    Fed decision0.27% ×6.50.49% ×5.00.58% ×3.2
    CPI0.31% ×3.90.62% ×3.10.71% ×4.1
    Payrolls0.35% ×4.40.62% ×3.00.57% ×3.1

    Median range of the first 15 minutes after the release · × the same 15 minutes on days without news · broker M15 prices 2022–2026 · 12 symbols measured.

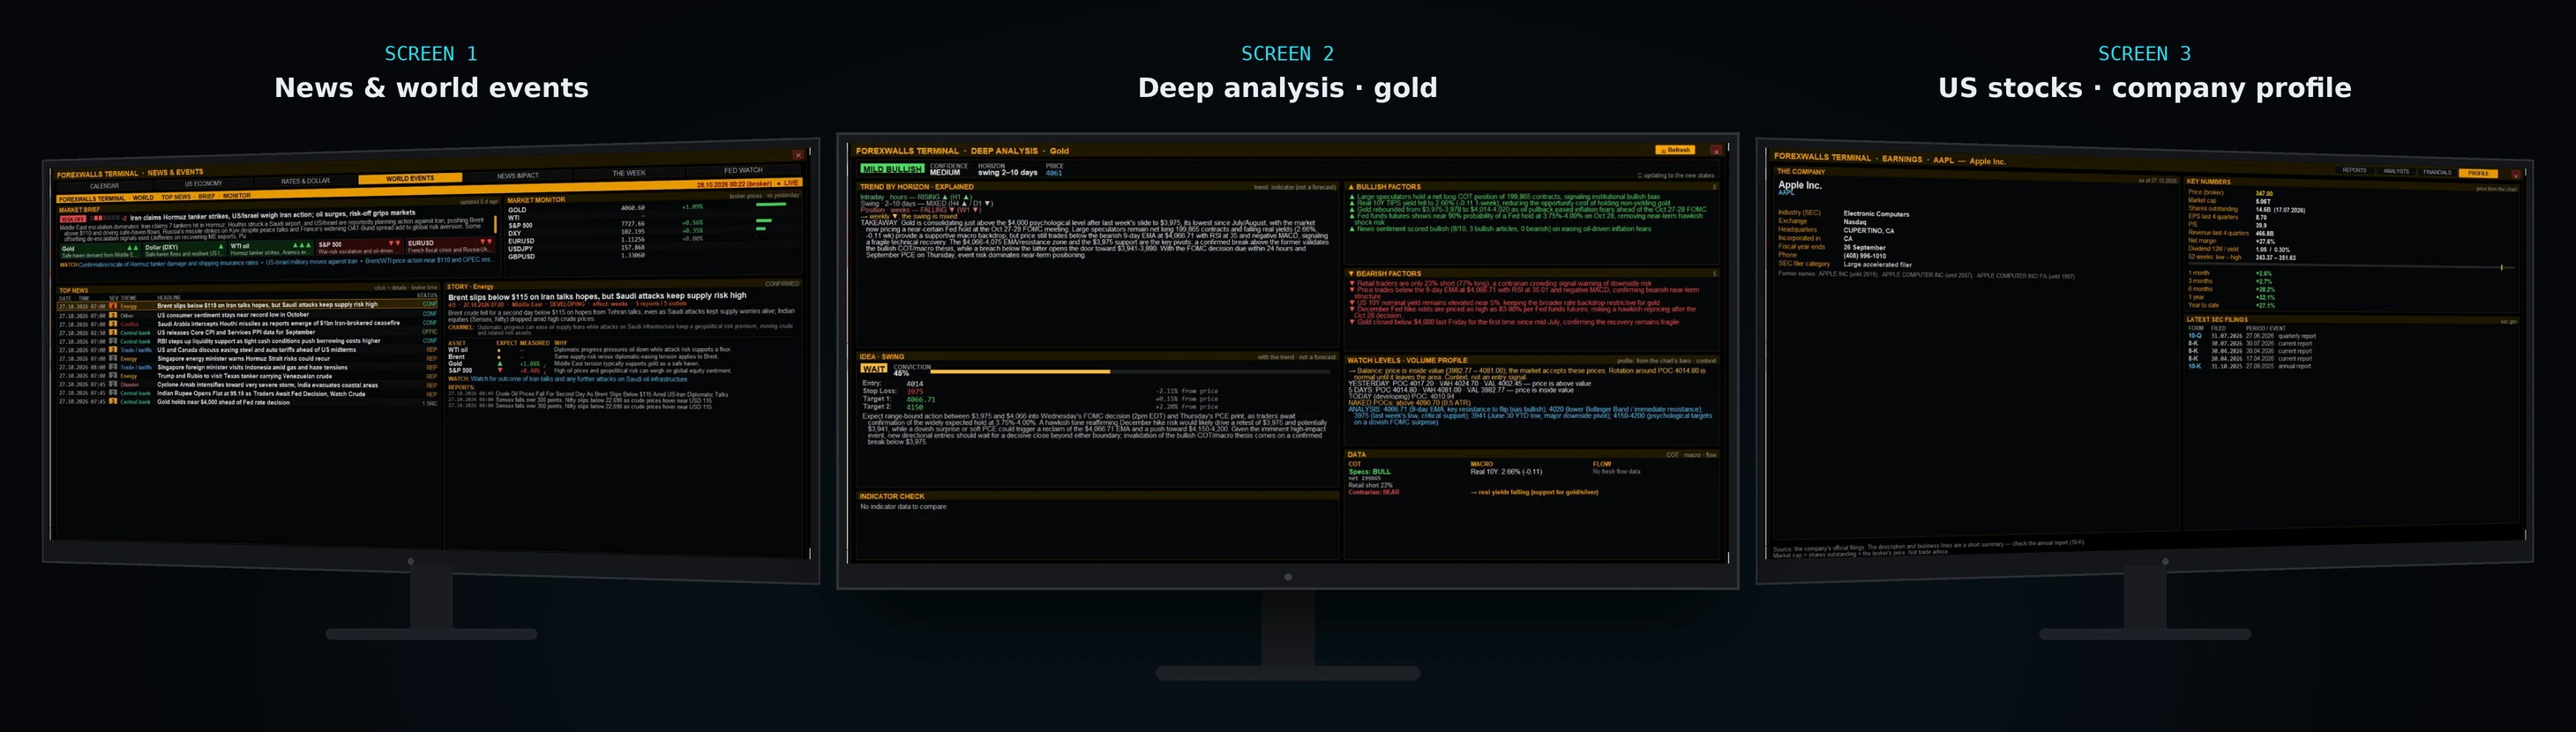
    World events. Wars and ceasefires, Hormuz and shipping, sanctions, central banks — merged from global sources every 15 minutes, official releases first. A market brief, the top events with severity 1–5, the story with its transmission channel, and for each asset the expected reaction next to the move actually measured since.

    The week. Monday to Friday on one screen: the key release of each day, company reports, what the banks expect for your symbol, and the releases that usually move it the most, with the typical 15-minute move.

    Fed watch. Hold, cut or hike at the next meetings, from the futures on the Fed rate: today's odds, the change over 7 days, and how the expectations moved over 30 or 90 days. What the market already prices in.

    10 — Order flow · CME

    Marketmicrostructure.

    Liquidity is not a line on a chart — it is a structure with depth. ForexWalls Terminal reads bid and ask depth as an environment: where liquidity concentrates, how it shifts, and how price interacts with it.

    • BID
    • ASK
    • PRICE
    • VOLUME
    • LIQUIDITY
    Measures
    Resting size on the CME futures order book — where large orders defend a price.
    What you see
    Bid and ask wall bands on the chart, the CME FLOW box, and the walls voting in the consensus (ELITE).
    Coverage
    Major FX, metals and oil futures; walls can be pulled. The 3D view here is illustrative.

    THE 3D BOOK IS ILLUSTRATIVE · THE CME FLOW BOX IS REAL · SWITCH IT ON WITH THE CME DATA BUTTON

    Context

    11 — Deep analysis, banks & positioning

    The view beyondyour timeframe.

    Four windows add the context a chart cannot show: a 1–5-day analysis checked against the indicator, what the big banks forecast, where the large speculators are positioned — and, on US stocks, the earnings reports.

    Deep analysis. Key takeaway, bullish and bearish factors with numbers and dates, a trade setup with entry, stop, two targets and R:R, and an indicator check: when the analysis disagrees with the chart, the window says so and caps its conviction. It is written from live news and data and checked by our server — levels are validated against the live price, R:R is calculated, not written.

    Bank forecasts. Published targets of major banks for 1–24 months on 11 instruments: the median, how far it is from today's price, the path by horizon, each bank's reason, and one conclusion. Background, not timing.

    COT report. The weekly COT positioning report: who is long and short, where speculators sit in their 3-year range, and what followed in our test of 15 instruments (2020–2026): the extremes below 25 and above 90 moved the 13-week odds by 10–14 points; the middle moved nothing. On the S&P 500, Nasdaq-100, Dow and Russell it adds the financial-futures breakdown: asset managers, leveraged funds and dealers, each against its own 3-year range.

    Earnings. On a US stock chart: the next report date (estimated from the same quarter last year) with before-open / after-close, how the stock reacted to its last 12 reports — gap, day move and move in ATR, measured on your broker's prices — how many of them went through a 2.8 ATR stop in one day, and eight quarters of revenue and EPS with year-on-year change. From the companies' official reports — so you know the risk before the report.

    • AAPLNext report 29.10.2026, after the close · stop 2.8 ATR = 5.2% of price · 2 of the last 12 reports went through it in one day (example, 15.10.2026)
    MetaTrader

    13 — Install

    Running infive minutes.

    Two files: the indicator draws everything, a small Bridge checks your licence and downloads the data. Nothing ever places a trade.

    • 01Download the MT5 or MT4 package from your receipt. Copy the indicator to Indicators and the Bridge to Experts (File → Open Data Folder → MQL5 or MQL4).
    • 02Tools → Options → Expert Advisors → allow WebRequest for https://api.forexwalls.com.
    • 03Attach the Bridge to any chart, enter your e-mail, choose English or Bulgarian, switch Algo Trading (MT5) or AutoTrading (MT4) on.
    • 04Attach the indicator to the charts you trade. One licence covers 1, 2 or 3 accounts depending on your plan — MT4 and MT5 count the same.

    The user guide explains every row, button and window, with a worked example.

    METATRADER 5 · FOREXWALLS TERMINAL

    How it works

    No black box.Every product, explained.

    Each part of the terminal answers one question, shows how it got there and says which timeframe it is for. Below: how the whole terminal works, which tool to read on which timeframe, and every product on one card — what it answers, how it works, what to watch and where it works best.

    1Install two files

    The indicator draws on your chart. The Bridge — a small Expert Advisor — checks your licence and brings in the data. On a new symbol, scroll the chart fully to the left once and switch the timeframe a few times until everything fills in.

    2Layers, not a black box

    The market is read in independent layers — state, slope, risk, exhaustion, structure, context. Each answers one question; the panel shows where they agree and where they do not.

    3Windows on a click

    Buttons open full-size windows over the chart — news, banks, COT, analysis, probabilities, market tools. The ⧉ button sends any of them to its own window for a second monitor.

    4You decide

    Nothing trades for you: the terminal never opens, closes or modifies a trade. Every level and number is context for your decision.

    What runs where. All chart analysis — regimes, Kalman, GARCH, the exhaustion count, Fibonacci, Wyckoff, the consensus, the entry logic and the new market tools — is calculated on your computer from your broker’s prices, so it works at the weekend too. News, positioning, bank forecasts, the deep analysis and the order-book data come from our servers through one address and one small Bridge that checks your licence. The terminal never places, changes or closes a trade.

    What to watch on which timeframe

    Pick the style you trade and read the tools in this order. All of it works on every timeframe — this is where each tool earns the most.

    M15 – H1Intraday

    Context from D1: regime, Wyckoff phase, Fibonacci leg. Then the calendar for the next 36 hours — stand aside from a big release. Trade on H1, time the entry on M15. Stop from the H1 row; check the session value area in the volume profile.

    H4 – D1Swing

    Direction from D1 or W1. Read the vote and the Entry block on H4 (D1 for slower swings). Stop from the H4 or D1 row; target the HMM target if its ETA is reasonable, otherwise the first EXT. Then the background: COT, the 1–5-day analysis, STRENGTH for the pair, and RISK for the book.

    D1 – W1Position

    Structure on W1 and D1. The 3-month to 1-year odds in PROBABILITY, the bank targets, the 3-year COT index and SEASONALITY. Size the trade from the 80% range in VOLATILITY 3D, check CORRELATION against what you already hold, and RISK for the very bad day.

    ToolIntradayM15 – H1SwingH4 – D1PositionD1 – W1
    Trend by horizon (panel)Intraday · hoursSwing · 2–10 daysPosition · weeks
    Regime & KalmanH1 — confirm on D1H4 / D1 — direction from W1D1 / W1
    Entry blockREADY / NOW on H1READY / NOW on H4Timing only, once D1 and W1 agree
    Stop guideH1 rowH4 / D1 rowD1 row
    Fibonacci & EXT targetsThe H1 leg, first EXTD1 / H4 leg, EXT 127.2–161.8%W1 / D1 leg, far EXT
    Wyckoff phasesH1 phase inside the D1 oneD1 and H4W1 and D1
    Exhaustion countCD 9 / 13 on H1On H4 / D1On D1 / W1
    Volume profileSession POC and value areaLast 5 sessions, naked POCsVisible range on D1
    Volatility 3DRANGE on H1 (50 bars)H4 (35) / D1 (25 bars)Regime and RV term on D1
    Calendar & news impactCore: red bar, 15-minute moveThe next 36 hoursUS economy, rates
    World eventsSeverity 4–5 nowThe trend of the storyBackground
    COT—Weekly; extremes < 25 / > 903-year index, 13-week odds
    Bank forecasts—Background3–24 month targets
    Deep analysis—The 1–5-day viewBackground
    Probability map1 week1 week – 3 months3 months – 1 year
    STRENGTHTODAY · 1 WEEK1 WEEK · 1 MONTH3 MONTHS
    CORRELATION20 days60 days1 year
    RISKNormal day, bad dayBad day, very bad dayVery bad day, where risk sits
    SEASONALITYWeekday averagesThis month and the nextThe average year, 10–20 years
    Earnings (US stocks)Report date, expected gapThe last 12 reactionsFinancials, analysts

    Every product in one card

    Open a card for how it works, what to watch, its best timeframes and how it was checked. Plan labels show where each tool is included.

    Read the chartWhere the market is, which way it leans and where a trade makes sense

    THE PANEL — regime, Kalman, consensus, entryAll plansIs the market trending or ranging, how many layers agree, and is there an entry?
    How it works

    Independent layers each answer one question: a hidden-Markov regime (bull, bear or sideways, and how long it has lasted), a Kalman filter for the real slope, GARCH for volatility, an exhaustion count and the DAM oscillator. The consensus shows direction, strength and how many layers agree; the entry block says READY or NOW only when its conditions are met (for example 4 of 4) and WAIT, with what is missing, when they are not. All of it is calculated on your computer from your broker’s prices — it works at the weekend too.

    What to watch

    BULL or BEAR with Kalman agreeing and ADX ≥ 25 is a trend; SIDEWAYS or ADX ≤ 20 is a range — expect reversals at the edges, not breakouts. A conflict (for example BEAR but Kalman UP) is the panel telling you to wait.

    Best timeframes

    Read your own timeframe (H1–D1) and confirm on the one above it — the Correction row already looks one timeframe higher (H1 → H4, D1 → W1).

    How it was checked

    When all four trend horizons agree, the trend tended to continue: +0.20 ATR on average over the next 20 bars.

    STOP GUIDEAll plansWhere does my stop survive a normal pullback — in pips and in money per lot?
    How it works

    The stop is 2.8 ATR of your timeframe. The table shows H1, H4 and D1 side by side: the ATR, the stop distance, the loss for one lot, and the take-profit at your reward ratio (1:1 by default) — and how many of ten typical pullbacks the stop survives (about eight).

    What to watch

    Use the row of your timeframe. If the Wyckoff manipulation zone is closer and logical, the stop can go just beyond it. Size the position from the money column.

    Best timeframes

    H1 row for intraday, H4 for swing, D1 for position trades.

    How it was checked

    Median pullback 1.3 ATR; 80% stayed under 2.8 ATR — that is where the 2.8 ATR stop comes from.

    FIBONACCI & EXTENSION TARGETSAll plansWhere is price inside the current swing, and where are the next targets beyond it?
    How it works

    The impulse line and the 23.6–78.6% retracement levels, plus extension targets at 127.2%, 161.8%, 200% and 261.8%, each with its distance from price in ATR. FIB and FIB EXT switch on and off independently.

    What to watch

    50–61.8% is the classic pullback zone. A first extension target that is close in ATR is more realistic than a far one.

    Best timeframes

    The swing of your timeframe: H1 legs for intraday, D1 for swing, W1 for position.

    How it was checked

    Drawn from the structure — context for where a trade sits, not an entry signal.

    WYCKOFF PHASESAll plansWhich phase of the market cycle is price in — accumulation, markup, distribution, markdown — on every timeframe?
    How it works

    The engine judges the current range and draws the zone, its events (Spring, UTAD and others), a manipulation zone and the phase with its confidence. The PHASES line lists W1, D1, H4, H1 and M15 side by side. D1 is in every plan; every timeframe, the events and the manipulation zone are in Pro and Elite.

    What to watch

    A magenta manipulation zone with a quick return into the range is one of the clearest moments — the shakeout. A “?” on the phase means the range is new and the breakout decides. When W1, D1 and your timeframe show the same cycle the picture is clean; when they differ, that is information, not a bug.

    Best timeframes

    Check W1 and D1 first, then trade on H4 or H1.

    How it was checked

    Structure, not a stand-alone signal: as a signal on its own, its targets were no better than controls.

    EXHAUSTION COUNTAll plansHas this move run long enough to tire?
    How it works

    A setup-9 and countdown-13 count on the candles and on the DAM oscillator, next to the age of the regime (its duration against past regimes). RSI divergence marks tired trends.

    What to watch

    A green duration with a setup in progress is early; an orange duration with CD 9/13 or a count of 13 is late.

    Best timeframes

    Read it on your trading timeframe and compare with the one above it.

    How it was checked

    RSI divergence: 55.5% reversals against 49.9% base, on about 235,000 trend bars and 17 of 19 symbols.

    TREND CHANNEL, PATTERNS & CONEAll plansWhat is the frame of the move — and what does a typical swing look like?
    How it works

    A channel drawn from the structure; confirmed double and triple tops and bottoms and head-and-shoulders; and the CONE — a magenta path and a violet channel to the right of the last candle showing a typical push, pullback and target inside the normal range.

    What to watch

    The next channel touch usually holds. Patterns and the cone are context: patterns were not an edge on their own, and the cone illustrates a typical swing — it does not forecast.

    Best timeframes

    Channels and patterns on any timeframe; the cone on H4–D1.

    How it was checked

    The channel held about 73% of 14,098 channels. 3,207 patterns: not an edge on their own.

    Know what is comingThe calendar, the macro backdrop and the world — before they move your trade

    MACRO STRIP & NEWS ALERTAll plansWhat do the dollar, yields, oil and gold say today — and is a high-impact release due in the next hour?
    How it works

    A strip on top of the chart: the dollar index (your broker’s, or built from six currency pairs with the official formula), the US 10-year yield, oil and gold against yesterday’s close, and what together they imply for your symbol. Up to 60 minutes before a high-impact release a red bar counts down with forecast and previous; for 15 minutes after it shows the result and whether it was good or bad for the currency.

    What to watch

    A red bar means the rest of the panel is less reliable until the release has passed.

    Best timeframes

    Every timeframe; most important for intraday.

    CALENDAR & NEWS IMPACTPro · EliteHow far does this release usually move my symbol — and is my stop bigger than that?
    How it works

    The releases for your currencies in the next 36 hours with a live countdown, forecast, previous and actual. For each: the median move of your symbol in the first 15 minutes and the first hour, the strong move (exceeded one time in five) and how many times a normal 15 minutes it is. Official US results — CPI, payrolls, unemployment, PPI, oil stocks — are read straight from the official releases within minutes.

    What to watch

    A stop smaller than the strong move is easily taken by the release itself. The direction is a scenario only: the real surprise helps when it is big, and a small one is a coin flip.

    Best timeframes

    Intraday: plan the next 36 hours and stand aside from the release minute. Swing: do not open just before a big release.

    How it was checked

    12 symbols, M15, 2022–2026: Fed decisions ×5–6.5 a normal 15 minutes, CPI and payrolls ×3–4.

    US ECONOMY, RATES & DOLLARPro · EliteWhat is the macro backdrop for my symbol — growth, inflation, labour, the Fed, yields and the dollar?
    How it works

    Four macro tiles (growth, inflation, labour, Fed policy) with state and direction; a table of CPI, core PCE, payrolls, unemployment, claims, GDP, retail sales and more with the latest value, the previous one (with the first print if it was revised) and how unusual the change is; Treasury yields (2, 5, 10 and 30 years, the real rate, breakevens), the dollar and the curve — closing with a one-line conclusion for your symbol, for example “Pressure DOWN (strong dollar)”.

    What to watch

    It is the backdrop, not an entry. A strong dollar weighs on EURUSD-type pairs and metals and lifts USDJPY-type pairs; rising rates weigh on metals and US indices.

    Best timeframes

    Swing and position; for intraday only as a reason to prefer one side.

    How it was checked

    Official US data. A trend comparison, not a consensus “surprise”.

    WORLD EVENTSEliteWhich events in the world could move markets right now — and did the market agree?
    How it works

    Global news sources are scanned every 15 minutes and grouped into events — conflict, central banks, shipping, sanctions, financial stress — with a severity from 1 to 5. Each event shows how it reaches markets and, for gold, oil, the S&P 500 and others, the expected direction next to the move measured since the event appeared, with a tick when they agree.

    What to watch

    Severity 4–5 can move markets on its own. The most useful part is whether MEASURED agrees with EXPECT.

    Best timeframes

    All timeframes. For swing and position, the trend of the story (escalating, stable, easing) matters more than one headline.

    How it was checked

    The window describes the news and how the market reacted, so you can plan around it.

    ALERTSAll plansTell me when something changes — without watching the screen.
    How it works

    Choose which events alert you — entry signal, trend turn, horizons, exhaustion, news — and how: phone push, e-mail, pop-up or sound. A TEST button checks every channel.

    What to watch

    Start with the entry signal and news; add trend turns on the timeframes you actually trade.

    Best timeframes

    Set it on the timeframe of your chart.

    See who is positionedSpeculators, banks and the big resting orders

    COT REPORTPro · EliteWho holds what in the futures market — and what has followed when positioning was extreme?
    How it works

    From the weekly Commitments of Traders report: speculators, hedgers and small traders — long, short, net, the weekly change, open interest — and the 3-year COT index (0 = the shortest speculators have been in three years, 100 = the longest). USDJPY, USDCAD and USDCHF are inverted for you; on US indices the window adds asset managers, leveraged funds and dealers.

    What to watch

    Only the extremes matter: below 25 or above 90. Between 25 and 75 there was no edge.

    Best timeframes

    Weekly data — for swing and position. Not for intraday timing.

    How it was checked

    15 instruments, 2020–2026: when speculators were extremely short (below 25) the instrument rose about 10 percentage points more often than usual over 13 weeks; when extremely long (above 90), about 14 points less often.

    VIEW BANKSEliteWhere do major banks expect this market to be in one to 24 months?
    How it works

    Collected daily from public bank research: each bank’s target, its distance from today’s price, its view and the reason in one line — with the median target, how much the banks agree and the path by horizon (1, 3, 6, 12 and 24 months). For EUR/USD, GBP/USD, USD/JPY, AUD/USD, USD/CAD, USD/CHF, NZD/USD, gold, silver, the S&P 500 and the Nasdaq.

    What to watch

    Targets are published opinions, often for months ahead: they show where institutions expect the market to go, not when. Views older than 30 days are dimmed.

    Best timeframes

    Position (3–24 months); background for swing.

    CME DATA — liquidity wallsEliteWhere do the big resting orders sit?
    How it works

    Resting orders and order flow from the CME futures that match your symbol are drawn as walls on your MetaTrader chart, with a legend and the CME FLOW box. The walls also enter the consensus. Covers the major pairs, gold, silver and oil.

    What to watch

    Price tends to react at walls. The layer is off by default (button CME DATA) so the chart stays clean until you want the order-book view.

    Best timeframes

    Any timeframe — the walls are levels, so they matter most when you plan entries and targets.

    DEEP ANALYSISEliteWhat is the 1–5-day view once positioning, macro, news and the indicator are put together?
    How it works

    For the main instruments it researches the live market — the current price, the last 72 hours of news, upcoming events, key technical levels — adds COT, macro differentials and the indicator’s own technical state, and writes a key takeaway, bullish and bearish factors, a trade setup (entry, stop, two targets, R:R) and an indicator check: AGREES, AGAINST or MIXED. An entry more than 3% from the price is rejected automatically.

    What to watch

    When it disagrees with the panel, the window says so — treat that as a reason to wait for the confirmation price, not to pick a side blindly. Against the indicator, its conviction is capped at 55%.

    Best timeframes

    A 1–5-day view: swing.

    Range and oddsHow far price can go, where it can be on a date, where the market traded

    VOLATILITY 3DAll plansHow far can price move over my horizon — and is the market calm or rough?
    How it works

    Today’s regime (compression, normal, expansion, stress) against the last three years; four volatility models ranked on your symbol by their recent accuracy; the 50% and 80% expected range for the cone horizon (H1: 50 bars, H4: 35, D1: 25); the events inside the horizon; and three 3D surfaces you can rotate — RANGE, RV TERM and IV SURFACE.

    What to watch

    The regime says calm or rough · the 80% range says how much room a trade needs · the events say when to be careful.

    Best timeframes

    H1, H4 and D1 (horizons of 50, 35 and 25 bars).

    How it was checked

    Out of sample on H1, H4 and D1: 79.7–81.3% of closes inside the 80% zone and 50.1–50.5% inside the 50% zone.

    PROBABILITY MAPPro · EliteWhere can the price be on a date — and what are the odds of reaching my target?
    How it works

    From 1 week to 1 year: the ±1σ range, the chance the price ends inside it (counted on the last 5 years), the 90% range and the median. Type a target price to see the chance the price closes beyond it on the date and the chance it touches it before. Cone and distribution on the right; on ELITE also the banks’ targets.

    What to watch

    Volatility now against the 5-year average: below 0.8× is calm (ranges tend to widen), above 1.25× is nervous (they tend to shrink). It is the size of a move, not its direction.

    Best timeframes

    Built from daily bars: 1 week to 1 month for swing, 3 months to 1 year for position.

    How it was checked

    Daily prices 1971–2026, 7 major pairs, walk-forward: the average gap between the stated and the real frequency was 1.3 points for ±1σ.

    VOLUME PROFILEPro · EliteWhere did the market actually trade — where is value, and which levels are untested?
    How it works

    One profile per session for the last 5 days and one for the visible chart, with the POC (most traded price), the value area (70% of the volume), VAH and VAL, and naked POCs — past POCs that price has not traded since. Built from one-minute volume spread over each bar’s range (correlation 0.978 against the real tick profile).

    What to watch

    Price inside the value area is balance; outside it is imbalance — watch the closes. A quick return inside means the new prices were rejected.

    Best timeframes

    H1 and M15 for session profiles; the visible-range profile on D1 for position context.

    How it was checked

    8 instruments, about 44 days: bounces at POC / VAH / VAL were 50% / 50% / 53% against 49% at random prices — context, not an entry signal.

    The market around your chartNew · MARKET TOOLS — one button, four tabs

    US stocksOn the stock’s own chart

    EARNINGS · ANALYSTS · FINANCIALS · PROFILEPro · EliteWhat does this US stock’s report mean for my trade — and how did it react to the last ones?
    How it works

    On US stock charts: the next report date (before the open or after the close), today’s 2.8 ATR stop against the average and the largest move on report days, the last 12 reactions (gap, day’s move in ATR, whether the stop was hit) and eight quarters of revenue and EPS. Tabs: REPORTS, ANALYSTS (the buy / hold / sell split and targets — Elite), FINANCIALS (up to six fiscal years) and PROFILE (what the company does, key numbers, latest filings).

    What to watch

    The date turns amber within 10 days and red within 3. If your stop is smaller than the usual report-day move, a gap can take it.

    Best timeframes

    D1 for the report cycle — swing and position. Intraday: stay aware of the date.

    How it was checked

    From the companies’ official reports. The next report date is an estimate from the same quarter last year and says so.

    This is how to read the tools — not trading advice. Every number above was measured on past data. The terminal never trades for you — every decision stays yours.

    14 — Access

    Simple, transparentaccess.

    Three plans — BASIC €200, PRO €300, ELITE €500 a month — one licence per email. Start with BASIC and add news analysis, company earnings, order flow and deep analysis as you need them.

    Every tool in every plan is tested on its own history — the results, including the failures, are in the Method section. Prices are per month per licence, before VAT; the total including VAT for your country is shown at checkout. Each plan is issued per email and linked to your MetaTrader accounts. Every plan includes both downloads: MetaTrader 5 and MetaTrader 4. 14-day free trial — card required, first charge on day 15 unless you cancel. Cancel online any time.

    15 — Method

    Built around process.Not hype.

    No testimonials. No performance claims. Just the method — in the open.

    • MT4 / MT5
    • Quantitative models
    • Statistical analysis
    • Market microstructure
    • Volatility
    • Probability
    • Information synthesis

    Validation — what the tests returned

    Each layer was tested against its own history before it shipped. Results are reported as they came out, including the ones that failed.

    Layer testedSampleOutcome
    RSI divergenceH119 instruments · H1 / H4 / D1~235,000 trend bars 55.5% reversal vs 49.9% base · z +4.3Holds on 17 of 19 symbols
    Correction depthStop guideSame sample Median 1.3 ATR · 80% under 2.8 ATRBecame the 2.8 ATR stop guide table
    CTA horizons in agreementAll fourSame sample +0.20 ATR over 20 barsTrend persistence — not a reversal
    COT positioning3-year speculator index15 instruments · weekly COT2020 – 2026 Below 25 and above 90 shift 13-week odds by 10 – 14 pp (t 2.1 – 2.9)Context row — not an entry signal
    COT extremes52-week index15 instruments2018 – 2026 · 251 episodes 52 – 53% against a 50% baseNo usable reversal signal — reported as such
    Wyckoff target · CORR line · setup range lines
    Regression & pivot channels
    Same sample No better than mirrored / offset controlsKept as drawing context only, never as a signal
    Chart patternsDouble / triple top & bottom · H&S13 instruments · H1 / H4 / D13,207 confirmed patterns 49.9% vs 50.6% for a random entryso PATTERNS is drawn as structure context
    Measured rangeVOLATILITY 3D · RANGE surface13 instruments · H1 / H4 / D1out of sample · 1,500-bar window 79.7 – 81.3% of closes inside the 80% zone · 50.1 – 50.5% inside the 50% zoneCalibrated — the zones mean what they say
    Volatility forecast modelsRW20 · EWMA · GARCH · HAR-RVPer symbol, livelast 250 forecasts · each from past data only Ranked by QLIKE in the window — e.g. gold H4: EWMA −7.5%, GARCH +38.8% at 20 daysThe best model differs by symbol — the window shows which one
    News — size of the moveNEWS IMPACT12 symbols · M152022 – 2026 · every release with ≥ 20 cases First 15 min after a Fed decision ×5 – 6.5 a normal 15 min, CPI and payrolls ×3 – 4Shown per release, in pips / points for your symbol
    News — MT5 good / bad flagDirection~1,700 USD releases per symbol2021 – 2026 48 – 52% in the "expected" directionNot used for direction
    News — direction after a surpriseActual vs forecast12 symbols · M15~340 big surprises each Big surprise: 55 – 60% textbook direction (GBP/USD 59.5%) · small: ~50%Shown as a scenario where significant — never as a signal
    Cone pathKalman push → pullback → target13 instruments · H1 / H4 / D189,203 historical paths Direction 50.1% vs 50.3% base · channel holds the close 1 – 13%Drawn and labelled as an illustration
    Probability map±1σ · 5–95% · target close / touch7 currency pairs · D11971 – 2026 · walk-forward, past data only Stated vs real frequency: ±1σ 1.3 pts · percentiles 1.6 · close beyond 0.8 · touch 0.9Size of the move, not direction
    Volume profile levelsPOC · VAH · VAL · naked POC8 instruments · ~44 daysprofile from one-minute bars · 0.978 vs tick profile Bounce 50 / 50 / 53% vs 49% at random prices · "80% rule" 41% vs 41%Shown as context — never as a signal

    Historical tests on past data. They describe what the layers did over the sample above — not what any market will do next, and not a performance claim.

    Builder
    Portrait of George, founder of ForexWalls Terminal
    George · founder, ForexWalls Terminal

    16 — Who builds it

    Built by a trader.For my own chart first.

    I'm George. I trade every day, and I build trading software — not another indicator or robot, but complete terminals: the data, the servers behind it, the analysis and every window on the chart, designed as one system. ForexWalls Terminal is that system on MetaTrader 5: the regime, the structure, the news, the positioning and the risk in one place — so that what was already there stops getting missed.

    “I put my name behind this product. ForexWalls Terminal does not sell signals. It is a complete trading-support system: real exchange data, positioning, macro and world news, risk tools — and the published test results for every tool, including the ones that don't work. You make the decisions. The terminal shows you what the market is doing.”— George, founder
    • 01Every layer is tested on its own history before it ships. The results — including the ones that failed — are in the Method section above.
    • 02What does not hold up stays as drawing context, never as a signal. Chart patterns are the latest example: tested, no edge found, so the PATTERNS button draws them and says exactly that.
    • 03Nothing in ForexWalls Terminal places a trade. It shows the context; the decision and the risk stay with you.
    • 04Built and supported in English and Bulgarian.

    17 — Questions

    Before youinstall it.

    Does ForexWalls Terminal trade for me?

    No. The indicator draws and the Bridge checks the licence and downloads data. Neither of them ever opens, modifies or closes a position.

    Is there a trading bot or an auto-trading version?

    No, and none is planned for sale. ForexWalls Terminal is an analysis tool for manual traders: it never sizes, opens or manages trades for you. The MT4 version is a full native indicator — it does not need MetaTrader 5 running next to it.

    Which platform does it run on?

    MetaTrader 5 and MetaTrader 4 on desktop (Windows or a Windows VPS). Every plan includes both downloads — your receipt has an MT5 package and an MT4 package; take the one your broker uses, or both. It is the same licence: each MT4 or MT5 account uses one slot of your plan. On MT4 the DAM oscillator is added by hand (MT4 does not let one indicator open another) and its built-in economic calendar lists the US releases (with the official result minutes after the release) and the ECB, BoE, BoJ, BoC and RBA rate decisions, because MT4 has no calendar of its own; everything else is the same. Mobile apps cannot run custom indicators.

    Is there a free trial?

    Yes — every plan starts with a 14-day free trial, once per customer. You enter a card at checkout but nothing is charged during the trial. Unless you cancel before it ends, the first monthly payment is taken on day 15 and the plan then renews every month until you cancel. We e-mail you 3 days before the end of the trial and 3 days before every renewal.

    How do I cancel — and can I get my money back?

    Cancel online in one click with the “Manage or cancel subscription” link in your licence e-mail and our reminder e-mails, or simply reply to any of our e-mails. Cancel during the trial and you pay nothing; after a payment your licence stays active until the end of the period already paid. You also have 14 days after your first payment to change your mind — see the refund policy.

    Which symbols can I use it on?

    Any symbol in your Market Watch — forex, gold, indices, oil. A few layers depend on outside data: COT exists only for instruments with a weekly COT report, and CME order-book data (ELITE) only for the futures it covers.

    How many accounts does a licence cover?

    One licence per e-mail. Basic covers 1 account, Pro 2 and Elite 3, demo or live. An account is linked the first time the Bridge runs on it, and a slot is released automatically after 3 hours without activity — so you can move to a new PC or broker account yourself.

    What happens if my internet drops?

    The Bridge checks the licence every hour and keeps working for up to 7 days offline — never beyond your paid-up date.

    The chart looks empty after I attach it. What do I do?

    Give it the history — the terminal calculates a lot on your own computer. On a new symbol scroll the chart all the way to the left (hold Home) until MetaTrader stops loading older candles, then, if something is still empty, switch the timeframe a few times (H1 → H4 → D1 → back) until the dashboard and the levels fill in. You do this once per symbol; after that it opens in seconds.

    How do I get updates?

    Updates are included in every plan. When a new version is out, the chart shows UPDATE AVAILABLE once, with an alert, and we e-mail you. The personal download link in your licence e-mail always gives the newest package.

    How should I use the chart patterns?

    As a picture of the structure. Double and triple tops and bottoms and head & shoulders are drawn on request with the PATTERNS button, with neckline, height and measured target — the neckline often turns into support or resistance on a retest. Combine them with the trend and the levels for the entry.

    Does it work on US stocks?

    Yes. On a US stock chart the EARNINGS window (PRO) shows the next report date, how the stock reacted to its last 12 reports on your broker's prices, how often a report went through a 2.8 ATR stop in one day, and eight quarters of revenue and EPS from the companies' official reports.

    Can I put NEWS or COT on a second monitor?

    Yes. Open a new chart, set Screen mode (NEWS, ANALYSIS, COT REPORT or EARNINGS) in the indicator settings, then right-click the chart tab → Undock and drag it to the other monitor. The window fills the chart and follows its size.

    Where do I start?

    The user guide walks through installation, every row of the panel, every button and window, with a worked example.

    See the marketdifferently.

    ForexWalls Terminal brings multiple analytical dimensions into one professional market intelligence environment.

    ForexWalls Terminal is an analytical tool. It does not provide investment advice and does not guarantee outcomes. Trading leveraged products involves substantial risk of loss.